· case-study · 6 min read
Building a Map-First Real Estate Data Platform
A case study on turning nationwide GIS source data, PNU-based modeling, PostGIS pipelines, map interaction, caching, and membership access control into one real estate data product.
In one sentence
We built a real estate data platform where users explore parcels, buildings, transactions, land-use rules, and commercial context on a map. The hard part was not drawing a beautiful map. It was turning nationwide source data into an operable data product.
The public name for this project is real estate data platform. Internal brand names, servers, accounts, API keys, payment details, and access commands are excluded from this article.
Not a map component, but a data product
The product started with a simple idea: real estate data should be understood in context, not only through tables. Parcels, buildings, transactions, zoning, official prices, commercial stores, and auction-related data come from different sources and update at different times.
So the first screen was designed as a data product, not as a map widget. The map, side panel, and table view share the same selected object.
- Map: exploration and selection
- Side panel: details for the selected parcel or building
- Table view: comparison, filtering, and sorting
Without this separation, the map component becomes the place where everything accumulates: API calls, normalization, access gates, and table conversion. In the early version, it became unclear which part of the app owned the selected real estate object. That was the first architecture problem to solve.
Selection tokens for map state
When a user selects a polygon or marker, the result is resolved into a parcel token, building token, and property hints. The map updates visual feedback quickly, while the side panel uses the same token to fetch land, building, transaction, zoning, and commercial data in parallel.
This structure lets one selected object flow into data tabs, filters, bookmarks, notes, and update views. It also reduced mismatches between map counts, table counts, and summary bars by forcing them to share query definitions.
Many map UX issues are actually API contract issues. If the map shows 50 records and the table shows 48 under the same filter, trust breaks. Viewport APIs therefore need to return items, total counts, summaries, and source breakdowns under the same filter rules.
PNU as the data backbone
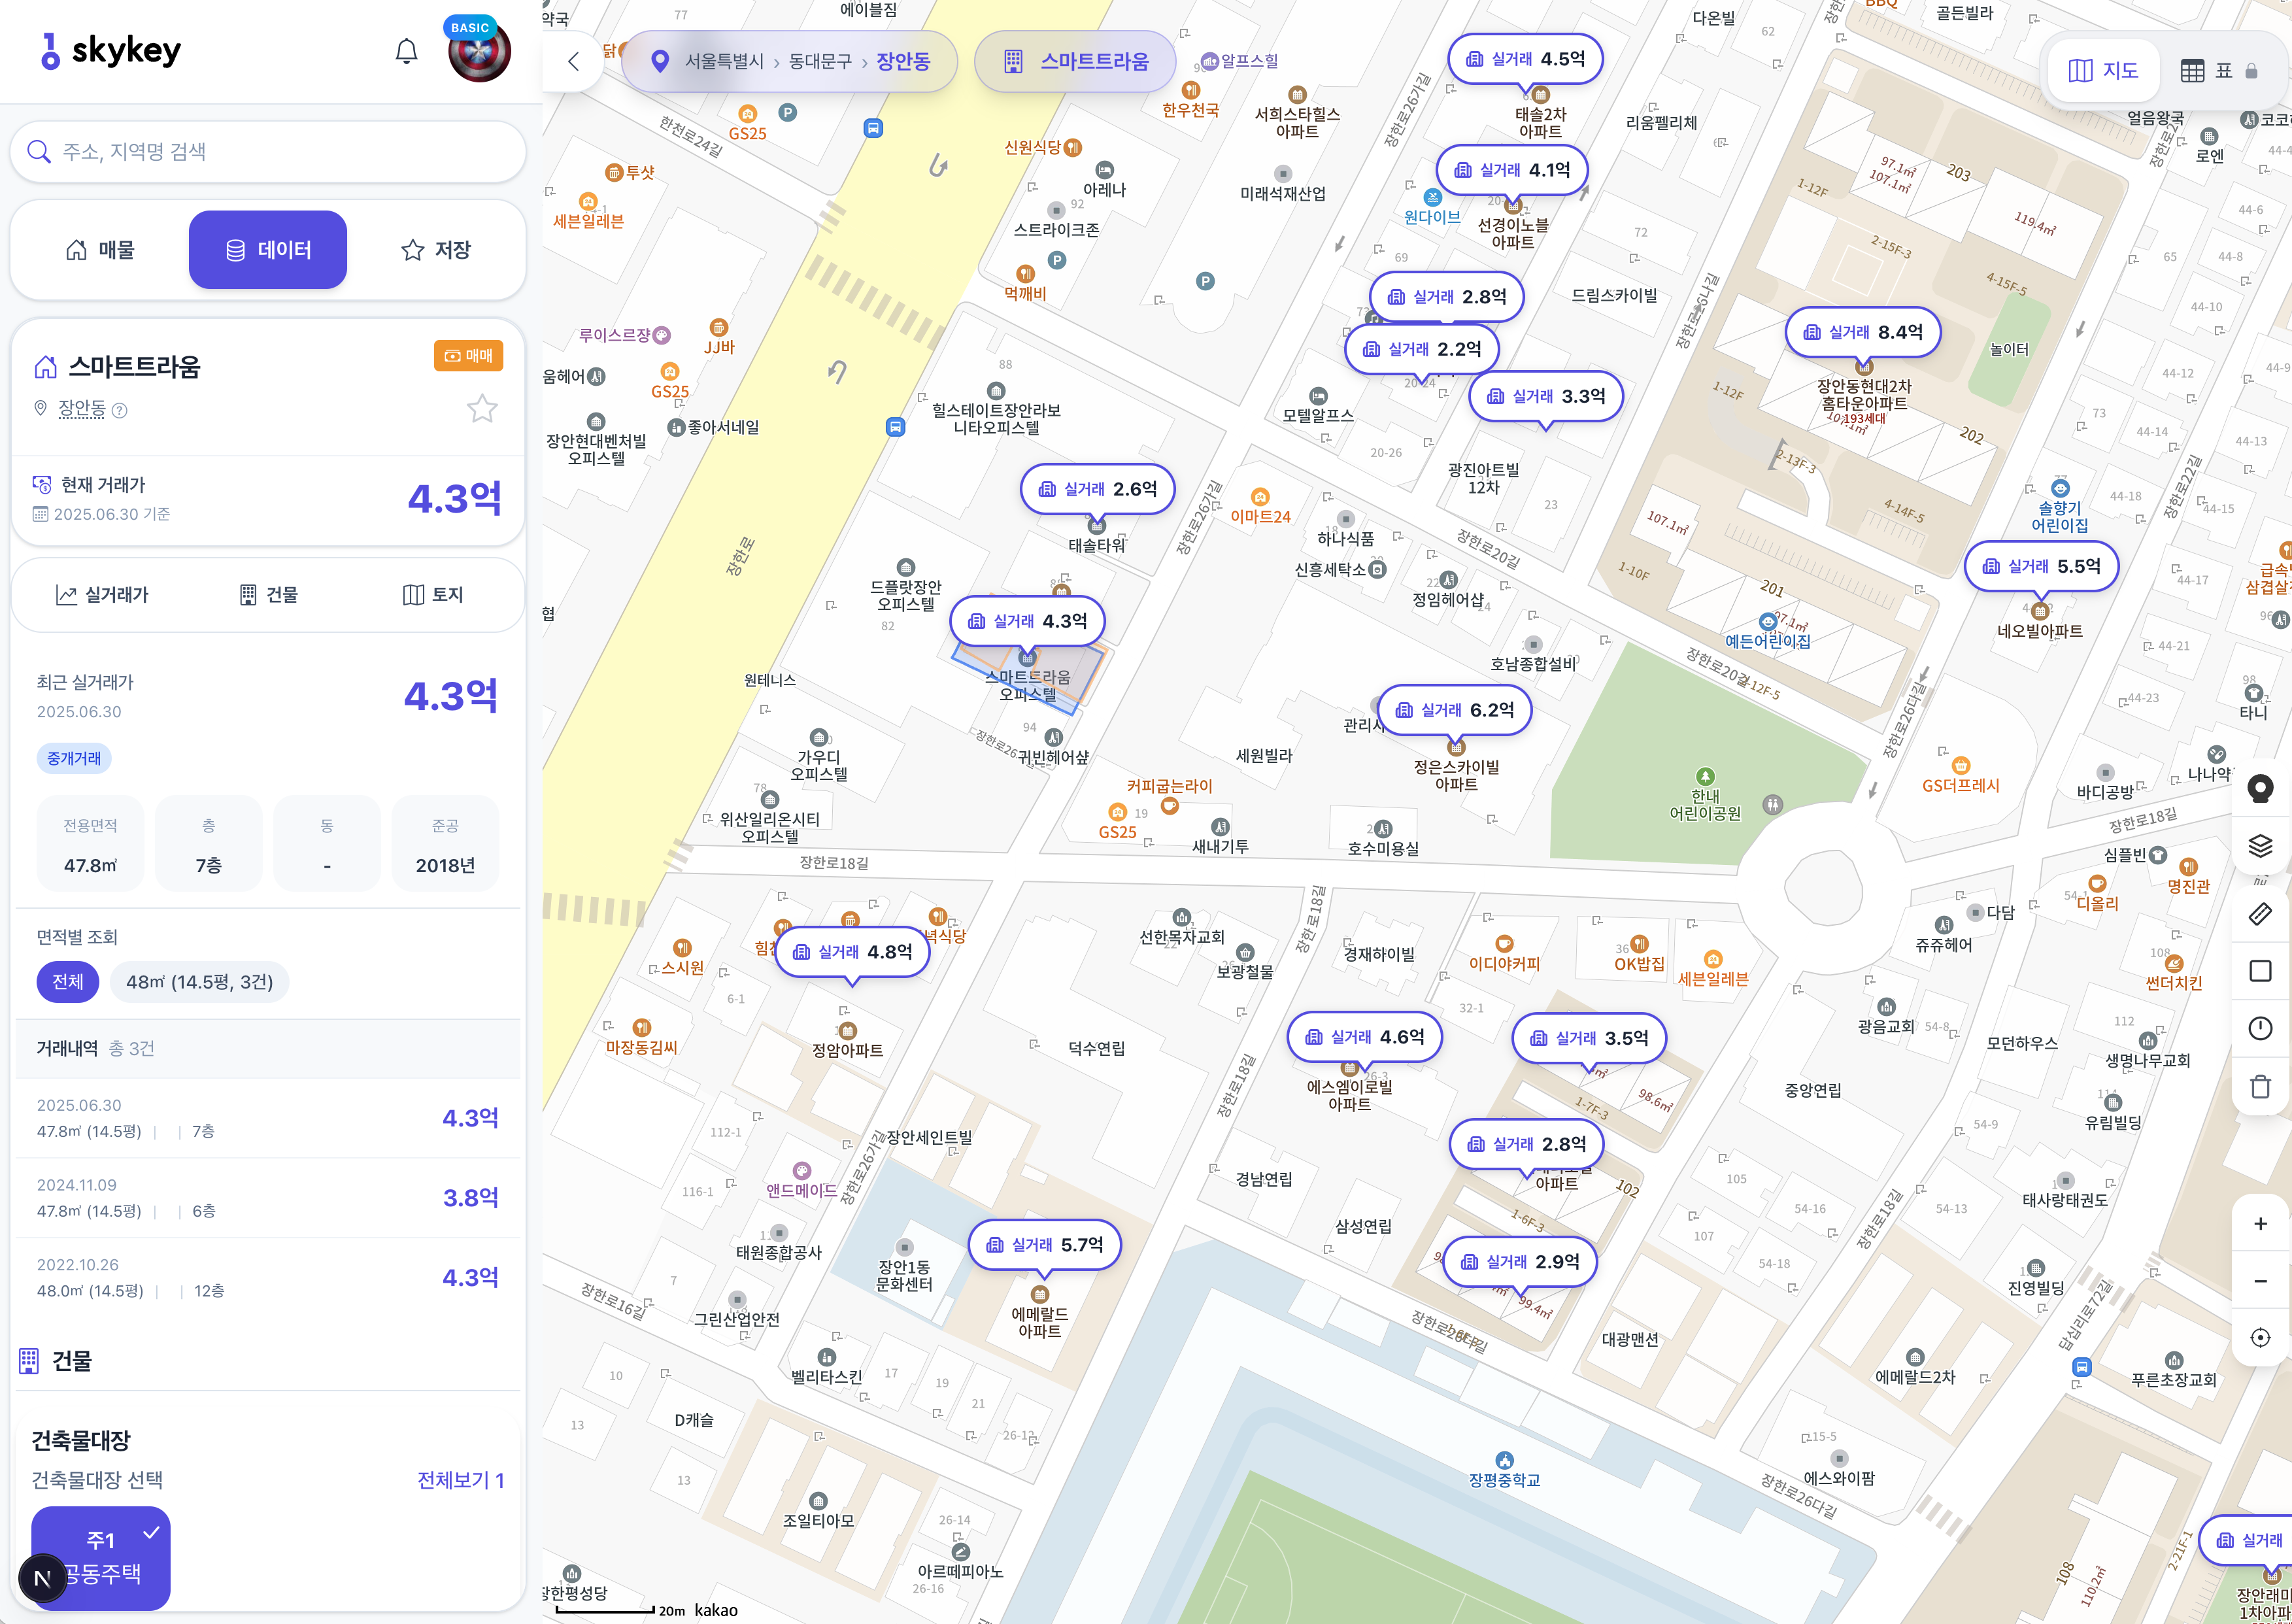
The first real data problem was that different sources name the same place differently. Transaction data may have legal-dong codes and lot numbers. Land data may have parcel identifiers. Building data may have building management numbers and PNU values. Commercial data may use store IDs, building IDs, coordinates, or address fields. Some transaction data is masked for privacy.
The platform uses PNU as the backbone. PNU is a 19-digit parcel identifier built from legal-dong code, land type, main lot number, and sub lot number. It became the key for connecting land registries, zoning plans, cadastral polygons, building polygons, transactions, and commercial data.
Not every dataset supports exact PNU matching. Some data cannot generate precise parcel IDs because lot numbers are masked or incomplete. Instead of pretending those joins are exact, the platform separates precise PNU lookup from regional lookup based on district and neighborhood. Good data engineering is not only about connecting more records. It is also about showing the confidence level behind each connection.
Matching building polygons and properties
Users expect related properties to appear when they click a building. The data does not always make that easy. Building polygons, parcels, property listings, transaction records, and commercial data do not always share one key.
The matching logic was therefore layered:
- Use reliable keys such as PNU or building management number when available
- Generate candidates with address normalization and lot-number parsing
- Use coordinates and radius-based hints when exact keys are missing
The important point is to separate exact matches from candidate matches. Users care not only whether results exist, but also how reliable those results are. In map-based data products, match confidence is product trust.
Nationwide GIS source data pipeline
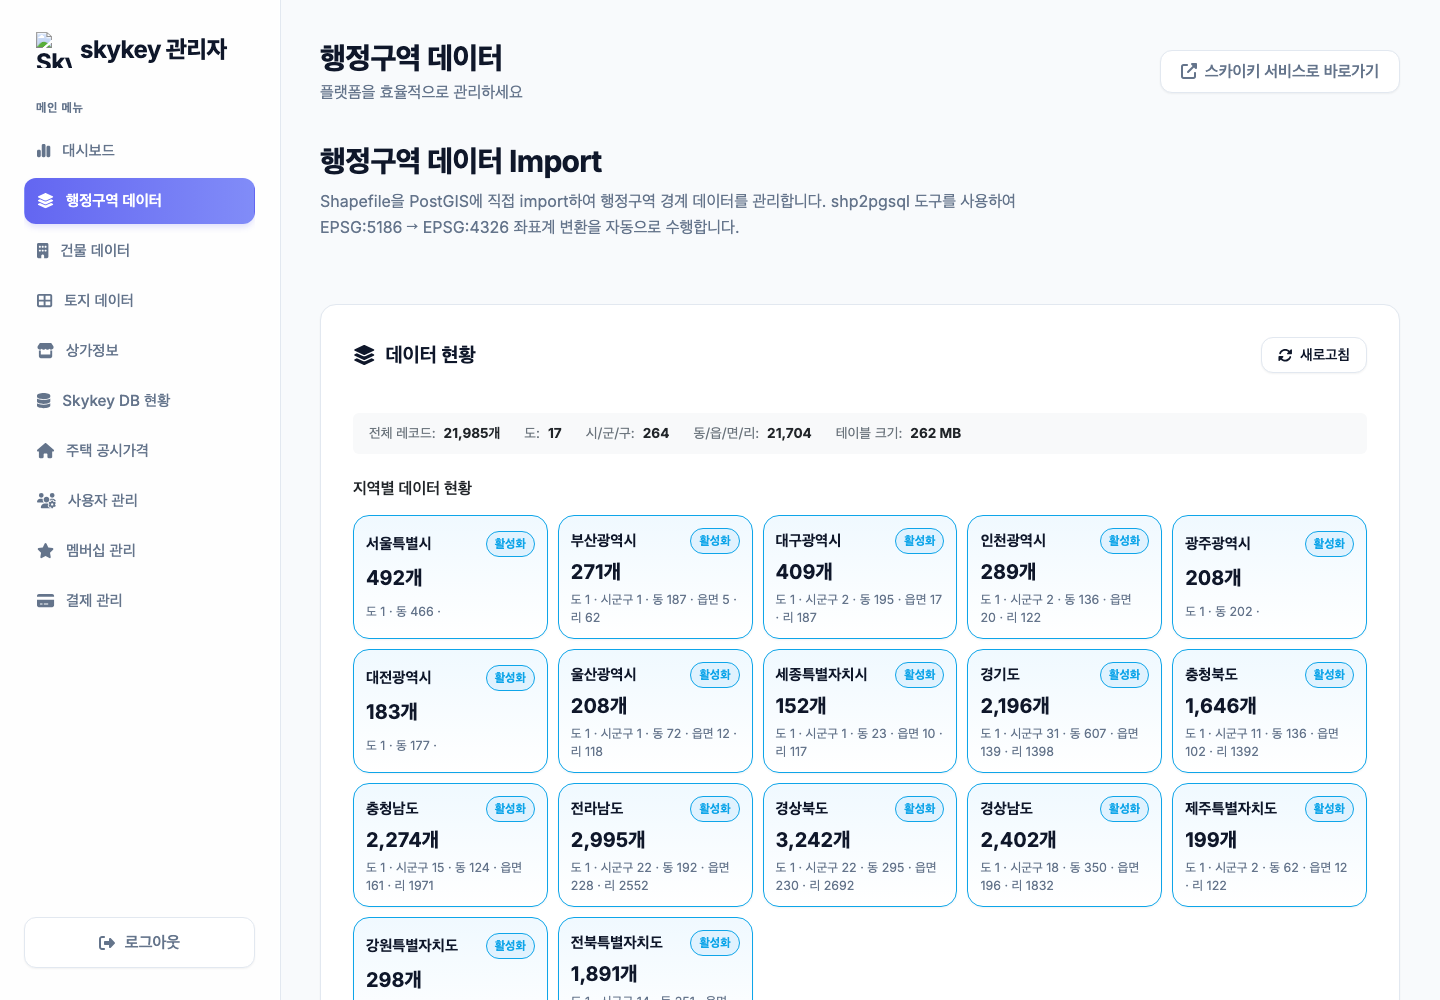
The strongest engineering story in this project was turning nationwide GIS source files into an operable pipeline. Source data arrived as Shapefiles, CSVs, public APIs, and regional files. Encoding, geometry validity, coordinate systems, and regional codes varied.
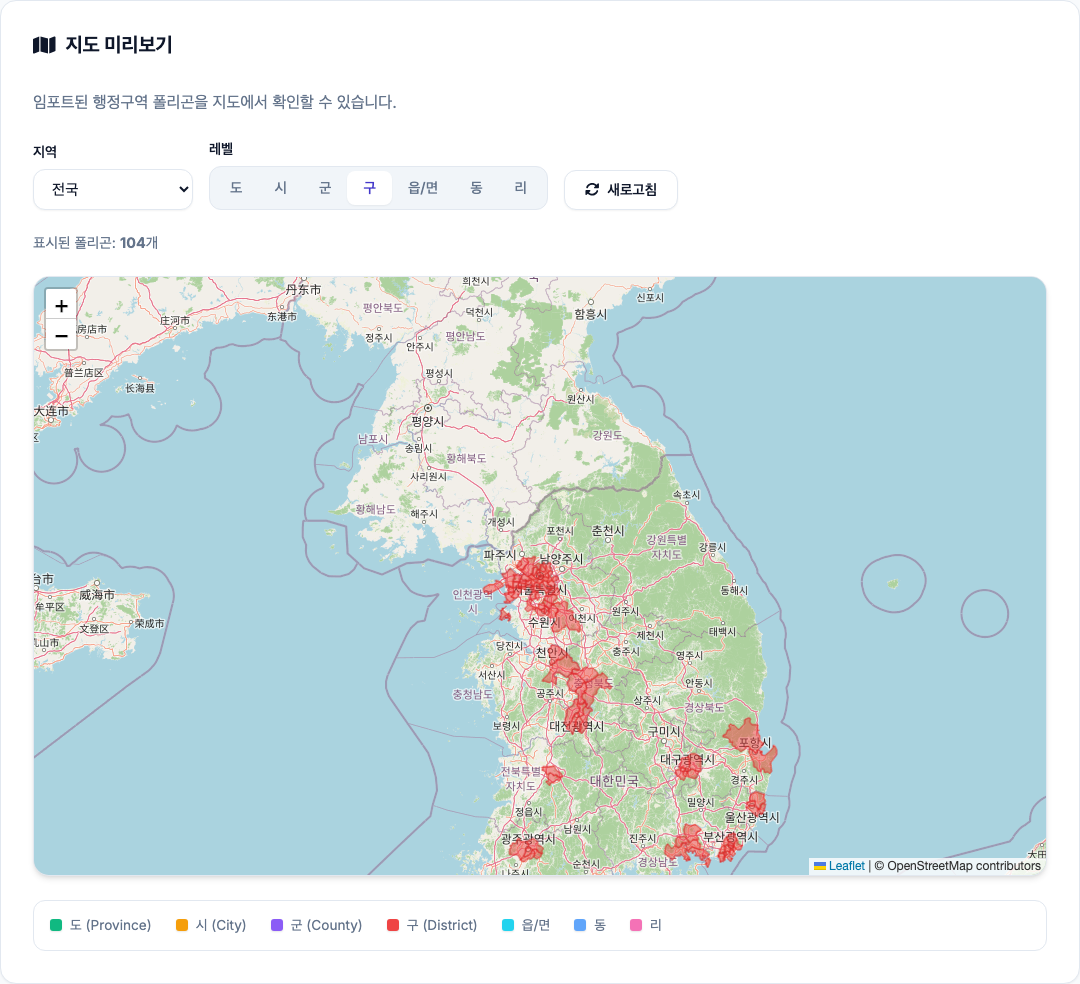
GeoJSON conversion was considered at first, but large datasets made conversion cost and intermediate file management painful. The pipeline moved toward direct PostGIS import. Files are processed by region and dataset, loaded into staging tables, validated, normalized, upserted, and used to refresh materialized views.
The main benefit is recovery. If a nationwide import fails as one large job, it is hard to know where to restart. If processing is split by region, dataset, and step, broken files, invalid geometry, encoding problems, and duplicate rows can be isolated and recovered.
Operational documentation became part of the system: upload steps, regional file rules, required packages, progress APIs, health checks, log formats, and rollback plans. Large GIS imports should not be designed around never failing. They should be designed around safe restart.
Caching and zoom-level precision
Browsers cannot receive nationwide raw data at once. At broad zoom levels, users need administrative aggregation. At detailed zoom levels, individual parcels and building polygons matter.
The map therefore changes precision by zoom level. Wide views show aggregated regions or centroids. Detailed views show markers and building polygons. The map is not only a visualization layer. It is an interface for switching data precision.
Caching also needed more than one layer. Summary data, filter results, viewport responses, and static polygon data all have different update cycles. Caching everything the same way makes the product fast but potentially wrong. Caching nothing makes exploration slow. The platform needed freshness and cost rules per dataset.
Membership and access control
A real estate data platform cannot expose every dataset in the same way. Some signals should be visible before login. Detailed data, downloads, and advanced analysis should require authentication and membership access.
Authentication and payment were therefore treated as a data policy layer, not as optional add-ons. The frontend centralizes login and membership access checks, and components receive the result to decide whether to show CTAs, blur overlays, or upgrade prompts.
The unauthenticated experience was designed as a preview, not a blank wall. Users can see enough map signals to understand the value, then sign in for deeper details. This flow shows usefulness before asking for conversion.
What we learned
The integration key is a product decision
PNU is not just a column. It is the coordinate system for the product. Once the trusted key is clear, map selection, side-panel details, transaction lookup, and commercial analysis can share one identity.
The map and table need one language
The map shows location and density. The table supports comparison and filtering. If they use different query rules, users stop trusting both.
Data import is an operations system
Nationwide GIS data is not a one-time upload. Source files change, regional files break, schemas shift, and imports fail. Staging, validation, restart, and rollback documentation make the product operable.
FAQ
How is this different from a normal map service?
A normal map service focuses on display. A data platform combines the map, side panel, table, access control, cache strategy, and data pipeline.
Is PNU required for real estate data?
You need a reliable integration key for parcel-level data. PNU does not solve every problem, but it is a strong backbone for connecting land, building, transaction, and zoning data.
How do you operate nationwide GIS data?
A practical pipeline splits files by region and dataset, uses staging tables, validates geometry, performs upserts, refreshes materialized views, and exposes progress and health checks.
If you are planning a map-based data product, GIS pipeline, or PostGIS-backed analysis platform, start a project with the dataset types and decisions your users need to make. The first useful conversation is usually about keys and update cycles, not map styling.
Hammergrid Lab builds map-based web services, data platforms, GIS pipelines, and permission-aware SaaS products.
Related services
3D web, 3dweb, 3D configurator, 3D product configurator, 3D product viewer, WebGPU, Three.js